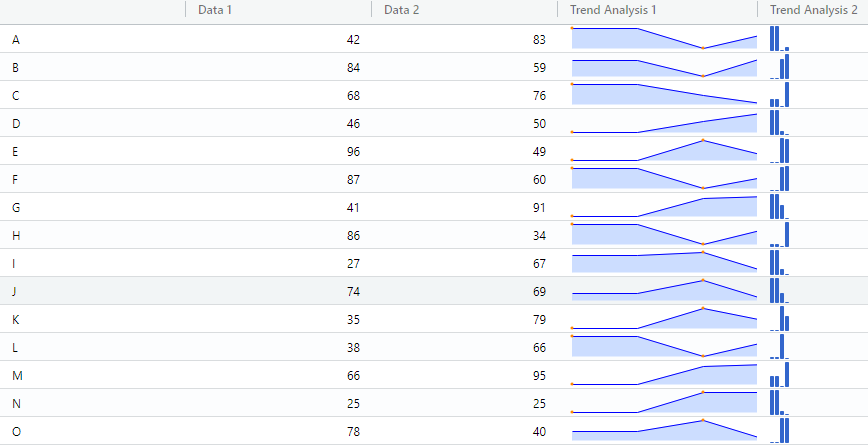
Sparkline Charts
Sparkline Charts in RagGrid
Here’s an example of creating Sparkline chart in RagGrid
Please check out jquery.sparkline for all the options that can be used.
library(RagGrid)
m = cbind(sample(20:100, 20, replace=F),sample(20:100, 20, replace=F),sample(20:100, 20, replace=F),sample(20:100, 20, replace=F),sample(20:100, 20, replace=F),sample(20:100, 20, replace=F),sample(20:100, 20, replace=F),sample(20:100, 20, replace=F),sample(20:100, 20, replace=F),sample(20:100, 20, replace=F))

rownames(m) = head(LETTERS, nrow(m))
colnames = c("Data 1","Data 2","S1","S2","S3","S4","S5","S6","S7","S8")
colnames(m) = colnames
sparkLineOptions = list("Trend Analysis 1"=list(startIndex=3,endIndex=6,type="line"),"Trend Analysis 2"=list(startIndex=7,endIndex=10,type="bar"))
aggrid(m,sparkLineOptions = sparkLineOptions)